How do you feed a city of 7.3 million people? In this section, we examine one of the keys to food supply – local food production.
Analysing available data from the Hong Kong Agriculture, Fisheries and Conservation Department (AFCD) (link) annual reports, we show the decline of agriculture in Hong Kong since the 1960’s.
We examine the factors that influence production levels such as the resources available for production as well as government response to these problems. We also reveal how certain metrics for food security such as self-sufficiency ratios can be misleading.
Fresh Vegetables
The overall narrative of Hong Kong’s production has been one of declining self-sufficiency, as the city became increasingly dependent on food imports. This is particularly striking in categories such as fresh vegetables.
Since the AFCD began data collection 50 years ago, the self-sufficiency ratio for fresh vegetables in Hong Kong has steadily gone downhill. Up until the 1980s, Hong Kong still produced 30% – 50% of what it consumed, however since the 2000’s, the self-sufficiency ratio has dropped to single digits, with the most recent figure standing at 1.82% in 2015. (Figure 1)
(fig 1) Fresh vegetable self sufficiency ratio in Hong Kong between 1964 and 2015
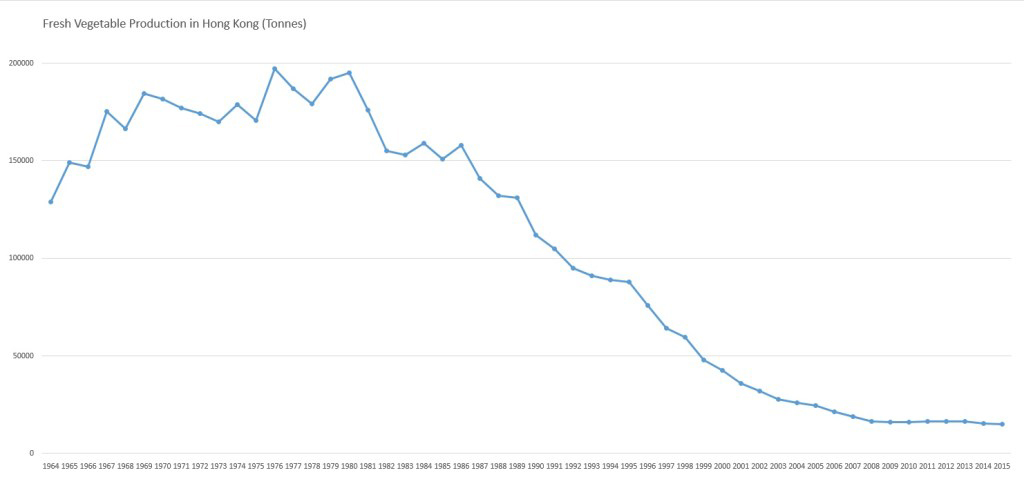
Hong Kong’s vegetable production stood at 128,820 tonnes in 1964, and increased to a high of 195,000 tonnes in 1980. The 1980’s saw a steady decrease in vegetable production from 195,000 tonnes in 1980 to 131,000 tonnes in 1989. The steady decline continued into the 2000s to the 2015 production level of 15,500 tonnes. (Figure 2)
(fig 2) Fresh vegetable production in Hong Kong between 1964 and 2015
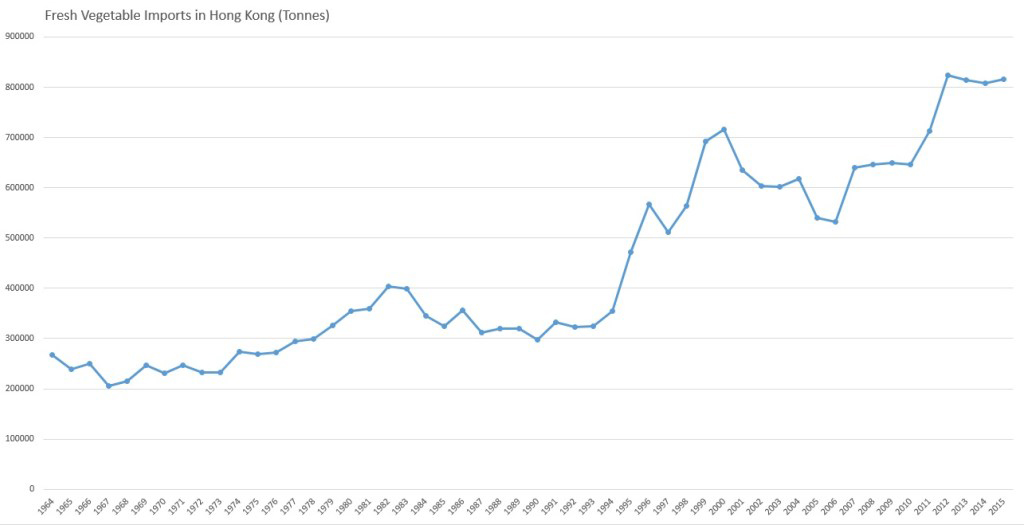
Vegetable imports on the other hand, have increased from 266,800 tonnes in 1964 to 815,363 tonnes in 2015. (Figure 3)
(fig 3) Fresh vegetable Imports into Hong Kong between 1964 and 2015
Why?
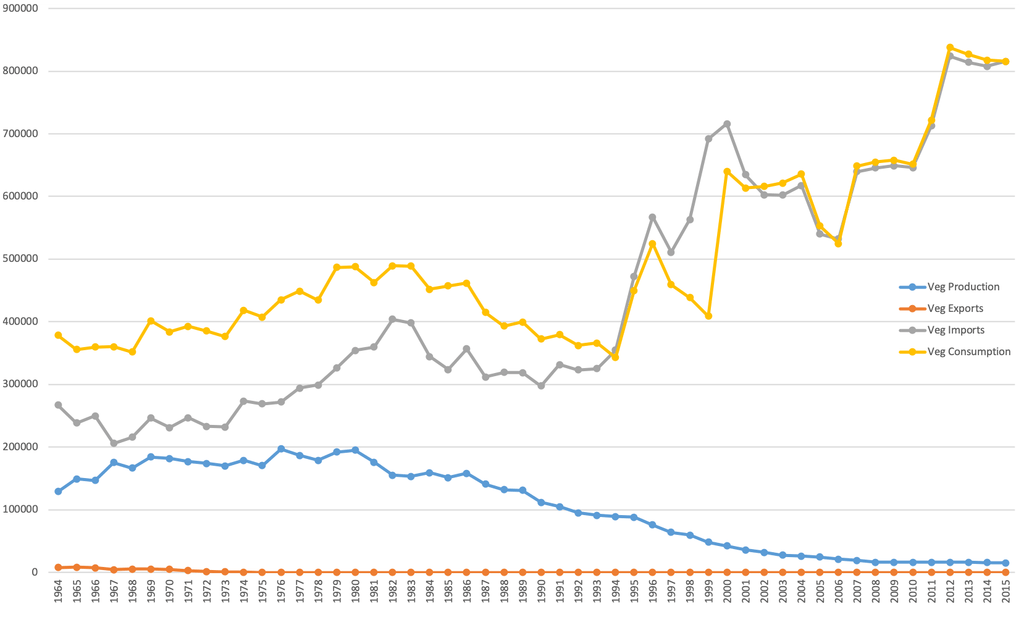
Like many urbanising cities, agriculture was left behind as Hong Kong’s economy took off towards light industries in the 1970’s and 1980’s. The lack of public investment in agriculture and research coupled with continual decline of farming resources such as labour and land in Hong Kong contributed to the fall in local production over the last five decades. This is evident in the correlation between declining fresh vegetable production in Hong Kong with the declining population of farmers and also the amount of farm land in Hong Kong. (Figure 4)
(fig 4) Hong Kong vegetable production, export, import, consumption.
Agricultural Land and Farmers
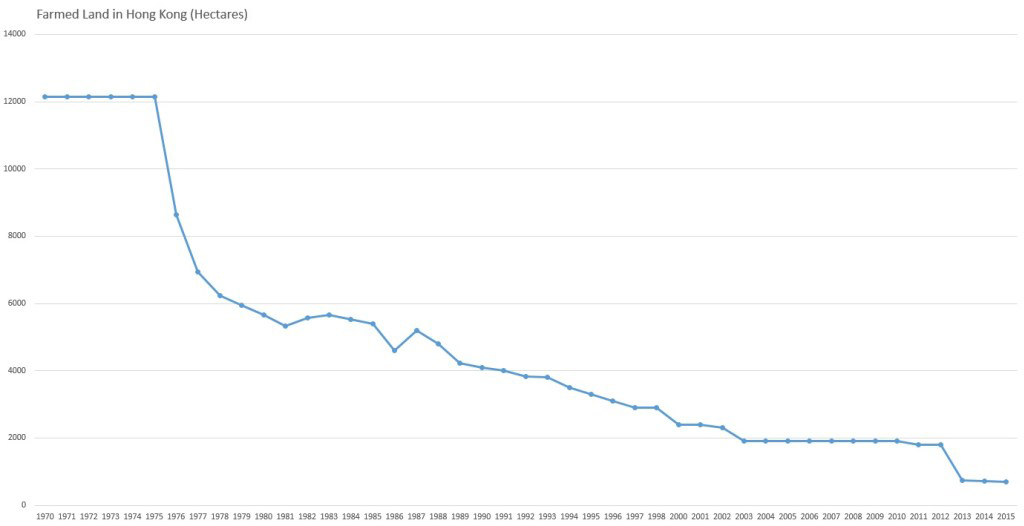
The AFCD reports show that we have lost approximately 10,000 hectares of agricultural land since the 1960’s. The amount of land being farmed in Hong Kong has declined from 12,140 hectares in 1970 to 690 hectares in 2015 (Figure 5). The percentage of fallow agricultural land went up from 13.7% in the 1960s to 84% in 2015.
(fig 5) Farmed land total size in Hong Kong between 1970 and 2015
The population of farmers in Hong Kong has also been declining since the 1980’s from 26,131 in 1986 to 15,200 in 1991 to an estimated 4,300 in 2015 (Figure 6).
(fig 6) Total farmers in Hong Kong between 1981 and 2015
Farmers have also decreased as a proportion of Hong Kong’s population from 0.95% in 1986 to 0.56% in 1991 to 0.11% in 2015 according to AFCD estimates (Figure 7).
(fig 7) Percentage of farmers against the total population of Hong Kong between 1981 and 2015
Agricultural Land and Farmers
The Hong Kong government recognised the problem of decreasing local vegetable production and initially proposed solutions that focused on intensifying production. In the 1960’s and 1970’s the AFCD advocated the use of nitrogen fertilisers to boost agricultural yields, in line with the thinking of the time. (Read more on Food Security=Production?)
In more recent times, the AFCD shifted to economically based incentives to encourage farmers to keep farming. The policy solutions that the AFCD have implemented since the 1960’s have reflected the free market economic policies of the Hong Kong government.
Going Premium
As the numbers of farmers decreased and increasing amounts of land became fallow the government has switched tack and shifted away from policy solutions that increased yields to policy solutions that provided economic incentives for more people to farm.
Starting in the 1990’s the AFCD has implemented policies to combat the decreasing amount of land being farmed and the decreasing number of farmers. These policies included encouraging farmers to grow more profitable vegetables, which was first tested in the 1990’s. Such crops included red cabbage, chicory, leeks and ‘some herbs’ in the early 1990’s. This policy continued into the 21st century with the introduction of crops such as spaghetti squash, white bitter gourd and courgettes in 2001 and more recently the promotion of growing premium vegetables such as improved varieties of bitter gourd and aubergines.
Going Organic
Contemporary issues concerning food safety with the use of synthetic inputs in food production and also with environmental protection have also led to the formation of organic farming standards in the Hong Kong at the end of the 20th Century.
In 2000 the AFCD established a pilot conversion scheme for farmers to convert to organic farming when a potential niche that was identified in a market survey, which found that there seemed to be an demand for organic food among consumers. The AFCD organic farming conversion scheme was officially launched in December 2000.
In 2002 Hong Kong Baptist University, the Hong Kong Organic Farming Association and Produce Green Foundation joined forces to form the Hong Kong Organic Resource Centre to establish standards for and also to promote an organic certification system. The standards and certification were applied in 2004 with 20 applicants processed that year, today, there are around 300 organic farms in Hong Kong. The AFCD also saw this measure as a way to retain farmers on the land, as it was viewed as another means for farmers to grow more profitable, premium crops.
Livestock
The story for local livestock production in Hong Kong while optimistic on the surface with increasing self-sufficiency for live poultry and live pork suggesting that local production is keeping up local demand, the consumption figures tell another story.
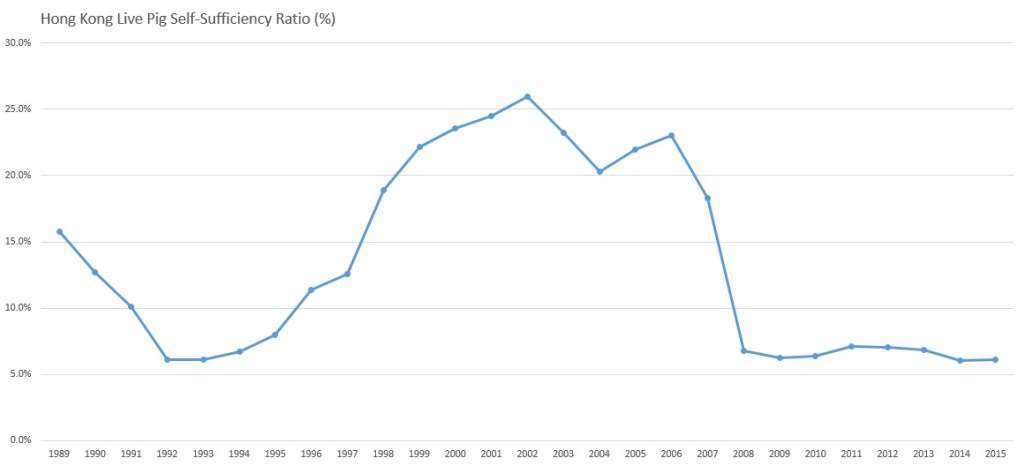
The self-sufficiency ratio for live pigs was 6.1% in 2015 with a peak of 25.9% in 2003 since data collection began in 1989 (Figure 8).
(fig 8) Live pig self sufficiency ratio in Hong Kong between 1989 and 2015
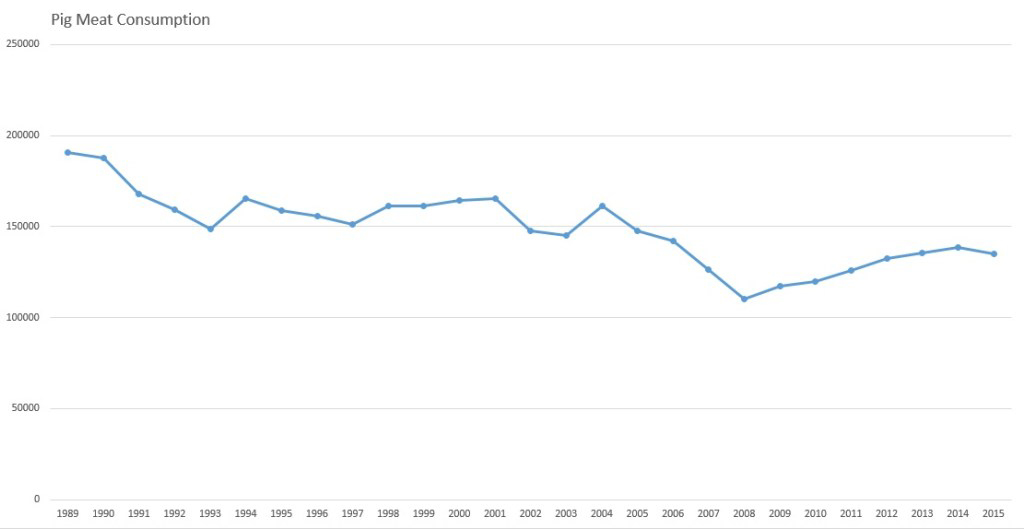
During the same period live pig consumption has declined from a 190,660 tonnes to 134,902 tonnes (Figure 9).
(fig 9) Live pig meat consumption in Hong Kong between 1989 and 2015
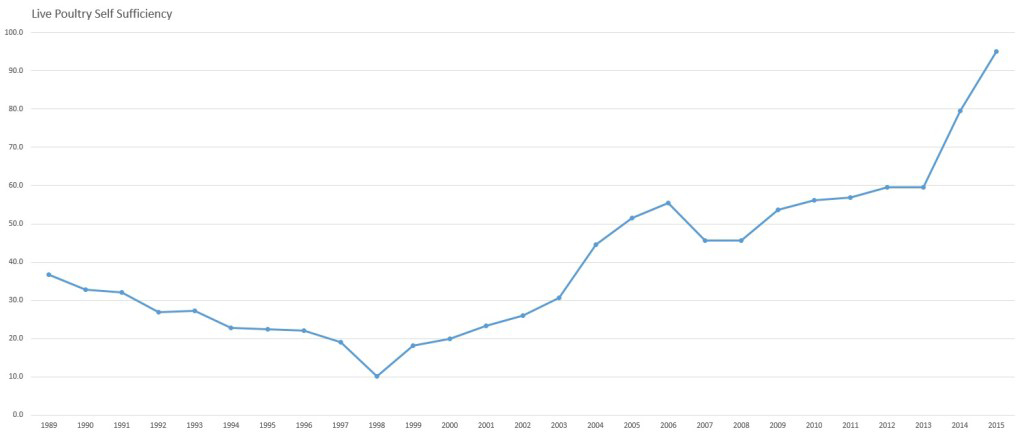
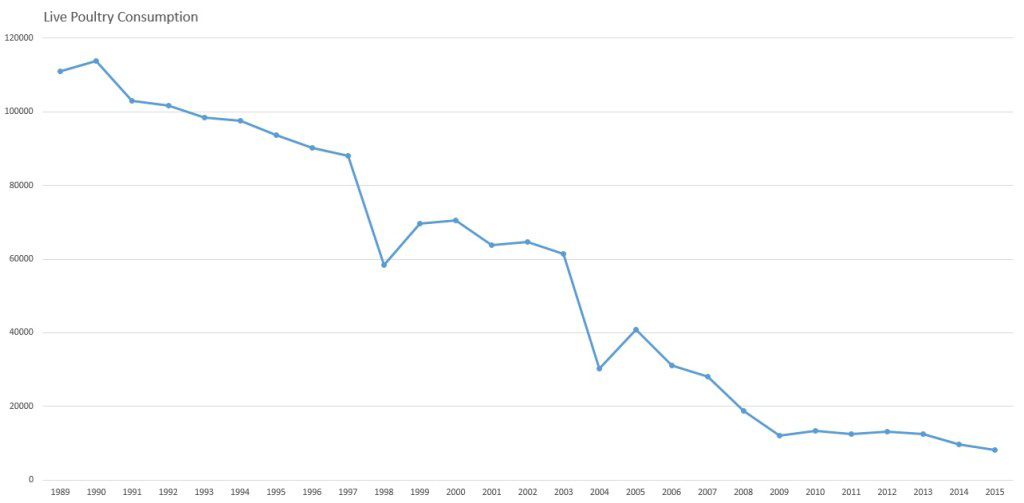
The high level of self-sufficiency was due mainly to decreasing consumption in the wake of the H5N1 Avian Flu outbreak in 2003. As can be seen in Figure 10 (below), consumption of live poultry fell by more than half from 61410 tonnes in 2003 to 30,140 tonnes in 2004. The consumption of live chickens has continued to decline. There was a brief upward recovery in 2005 to over 40,820 tonnes. However, this did not last, as consumption of live poultry would go on to decline in the years to follow to 8,225 tonnes in 2015 (See Figure 11). Both the cases of live pig and live poultry consumption show the limitations of self-sufficiency ratio as a measure for security, as consumption has been on the decline, which gives the misleading impression that enough pork and live poultry is being produced in Hong Kong to keep up with demand.
(fig 10) Live poultry self sufficiency in Hong Kong between 1989 and 2015
(fig 11) Live poultry consumption in Hong Kong between 1989 and 2015